
This post includes Macro Indicators of Rajasthan Economic Development of 2019-20 which are published in 2020. The facts & figures are based on data published in Economic Review of Rajasthan 2020 and State Budget 2020-21.
Gross State Domestic Product of Rajasthan at:
- (a) Constant (2011-12) Prices: 7,11,627 Crores
- (b) Current Prices: 10,20,989 Crores

Economic Growth Rate as per GSDP at:
- (a) Constant (2011-12) Prices: 5.05%
- (b) Current Prices: 8.32%

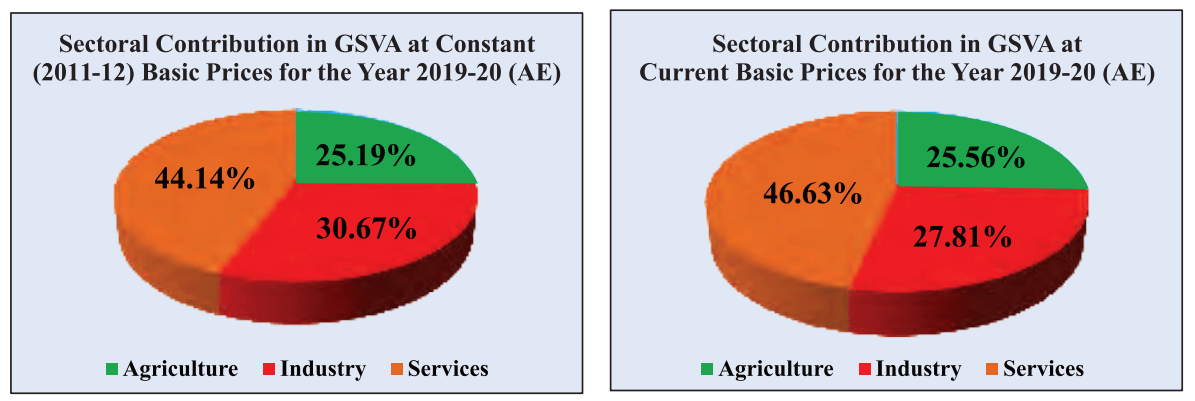
Sectoral Contribution of GVA at Current Prices by
- (a) Agriculture: 25.56%
- (b) Industry: 27.81%
- (c) Services: 46.63%
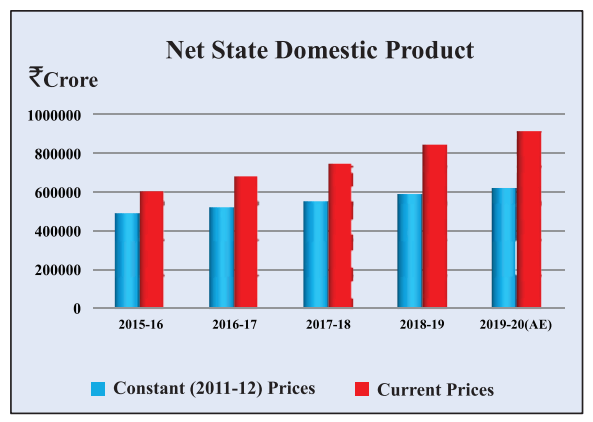
Net State Domestic Product at
- (a) Constant (2011-12) Prices: 6,30,695 Crores
- (b) Current Prices: 9,16,014 Crores
Per Capita Income at
- (a) Constant (2011-12) Prices: 81,355 INR
- (b) Current Prices: 118,159 INR

Macro Indicators of Rajasthan Economic Development in 2020
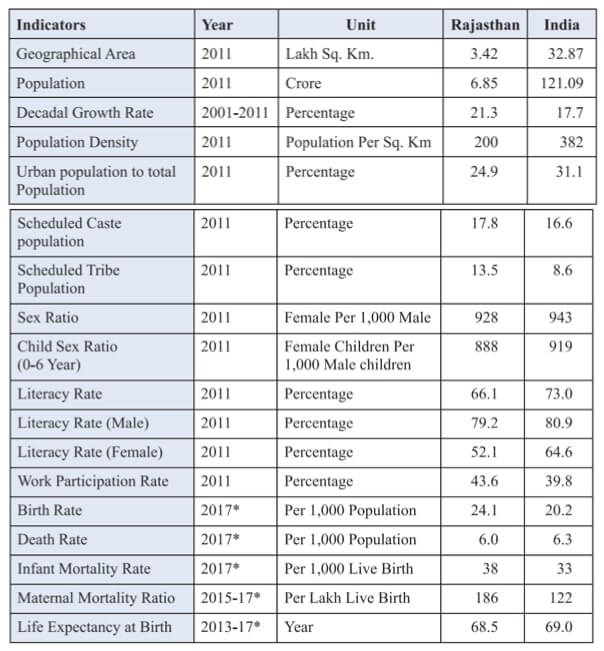
Key Indicators 2019 for Rajasthan vis-a-vis India
Price Inflation Indices Rajasthan:
- The Directorate of Economics and Statistics (DES) has been collecting the wholesale and retail prices of the essential commodities regularly, since 1957 from selected centres across the State on weekly basis.
- The Consumer Price Indices for industrial workers are prepared and released by the Labour Bureau, Shimla for Jaipur, Ajmer and Bhilwara centres of the State.
- The DES also prepares Building Construction Cost Index for Jaipur Centre.
Wholesale Price Index (WPI) Rajasthan
- Base Year 1999-2000=100
- The primary use of the state level WPI is in computation of GSDP as an indicator.
- WPI serves as an important determinant in formulation of trade, fiscal and other economic policies by the government.
- It is also widely used by the banks, industries and business circles. It is released on monthly
- It covers 154 commodities, of which 75 are from ‘Primary Articles’ group, 69 fromManufactured Products’ group and 10 from ‘Fuel and Power’ group.
- The Wholesale Price Index for ‘All Commodities’ moved from 300.27 in the year 2018 to 310.56 in the year of 2019, registered an increase of 3.43 per cent.
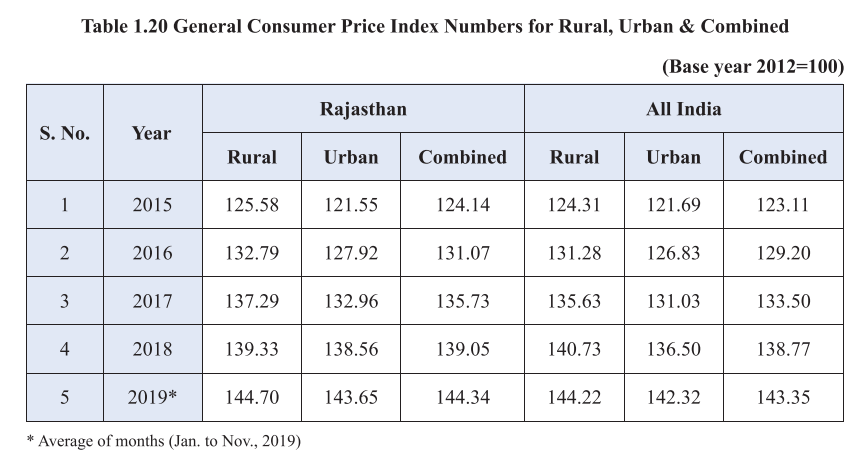
Consumer Price Index (CPI)
- At present there are four different types of Consumer Price Indices are being constructed every month. They are Consumer Price Index for
- Industrial Workers (CPI-IW)
- Agricultural Labourers (CPI-AL)
- Rural Labourers (CPI-RL) and
- Rural, Urban (CPI-R&U).
- The first three indices are constructed and released by the Labour Bureau, Shimla and the fourth one by the Central Statistical Office (CSO), New Delhi.
Gross Fixed Capital Formation
The Gross Fixed Capital Formation (GFCF) is measured by the total value of a producer’s acquisition less disposal, of fixed assets during the accounting period plus certain additions to the value of non-produced assets realized by the productive activity of institutional units.
- At the end of the year 2018-19, the total assets at current prices are estimated to be ₹2,56,731 crore
- This is 27.24% of the GSDP (₹9,42,586 crore).
- The GFCF in the year 2017-18 increased by 10.63 per cent over the previous year 2016-17.
Macro Indicators of Rajasthan Economic Development in 2020
Caution: Facts, figures & data as per Rajasthan Economic Review 2019-20 released in February 2020.


